

 Set up docs MCP
All data is ingested into ClickStack via an OpenTelemetry (OTel) collector instance, which acts as the primary entry point for logs, metrics, traces, and session data. We recommend using the official ClickStack distribution of the collector for this instance.
Users send data to this collector from language SDKs or through data collection agents collecting infrastructure metrics and logs (such OTel collectors in an agent role or other technologies e.g. Fluentd or Vector). For teams that want a managed OpenTelemetry pipeline, Bindplaneoffers an OpenTelemetry-native solution with a native ClickStack destination, simplifying telemetry collection, processing, and routing.
Sending OpenTelemetry data
Installing ClickStack OpenTelemetry collector
To send data to Managed ClickStack, an OTel collector should be deployed in a gateway role. OTel compatible instrumentation will send events to this collector via OTLP over HTTP or gRPC.
For further details see “Deploying the collector”.
Sending data to the collector
To send data to Managed ClickStack, point your OpenTelemetry instrumentation to the following endpoints made available by the OpenTelemetry collector:
- HTTP (OTLP):
http://localhost:4318 - gRPC (OTLP):
localhost:4317
For language SDKs and telemetry libraries that support OpenTelemetry, you can simply set OTEL_EXPORTER_OTLP_ENDPOINT environment variable in your application:
export OTEL_EXPORTER_OTLP_ENDPOINT=http://localhost:4318If deploying a contrib distribution of the OTel collector in the agent role, can use the OTLP exporter to send to the ClickStack collector. An example agent config consuming this structured log file, is shown below.
# clickhouse-agent-config.yaml
receivers:
  filelog:
    include:
      - /opt/data/logs/access-structured.log
    start_at: beginning
    operators:
      - type: json_parser
        timestamp:
          parse_from: attributes.time_local
          layout: '%Y-%m-%d %H:%M:%S'
exporters:
  # HTTP setup
  otlphttp/hdx:
    endpoint: 'http://localhost:4318'
    compression: gzip

  # gRPC setup (alternative)
  otlp/hdx:
    endpoint: 'localhost:4317'
    compression: gzip
processors:
  batch:
    timeout: 5s
    send_batch_size: 10000
service:
  telemetry:
    metrics:
      address: 0.0.0.0:9888 # Modified as 2 collectors running on same host
  pipelines:
    logs:
      receivers: [filelog]
      processors: [batch]
      exporters: [otlphttp/hdx]
The ClickStack OpenTelemetry collector is included in most ClickStack distributions, including:
Installing ClickStack OpenTelemetry collector
The ClickStack OTel collector can also be deployed standalone, independent of other components of the stack.
If you’re using the HyperDX-only distribution, you’re responsible for delivering data into ClickHouse yourself. This can be done by:
- Running your own OpenTelemetry collector and pointing it at ClickHouse - see below.
- Sending directly to ClickHouse using alternative tooling, such as Vector, Fluentd etc, or even the default OTel contrib collector distribution.
For further details see “Deploying the collector”.
Sending data to the collector
To send data to ClickStack, point your OpenTelemetry instrumentation to the following endpoints made available by the OpenTelemetry collector:
- HTTP (OTLP):
http://localhost:4318 - gRPC (OTLP):
localhost:4317
For language SDKs and telemetry libraries that support OpenTelemetry, you can simply set OTEL_EXPORTER_OTLP_ENDPOINT environment variable in your application:
export OTEL_EXPORTER_OTLP_ENDPOINT=http://localhost:4318In addition, an authorization header containing the API ingestion key is required. You can find the key in the HyperDX app under Team Settings → API Keys.
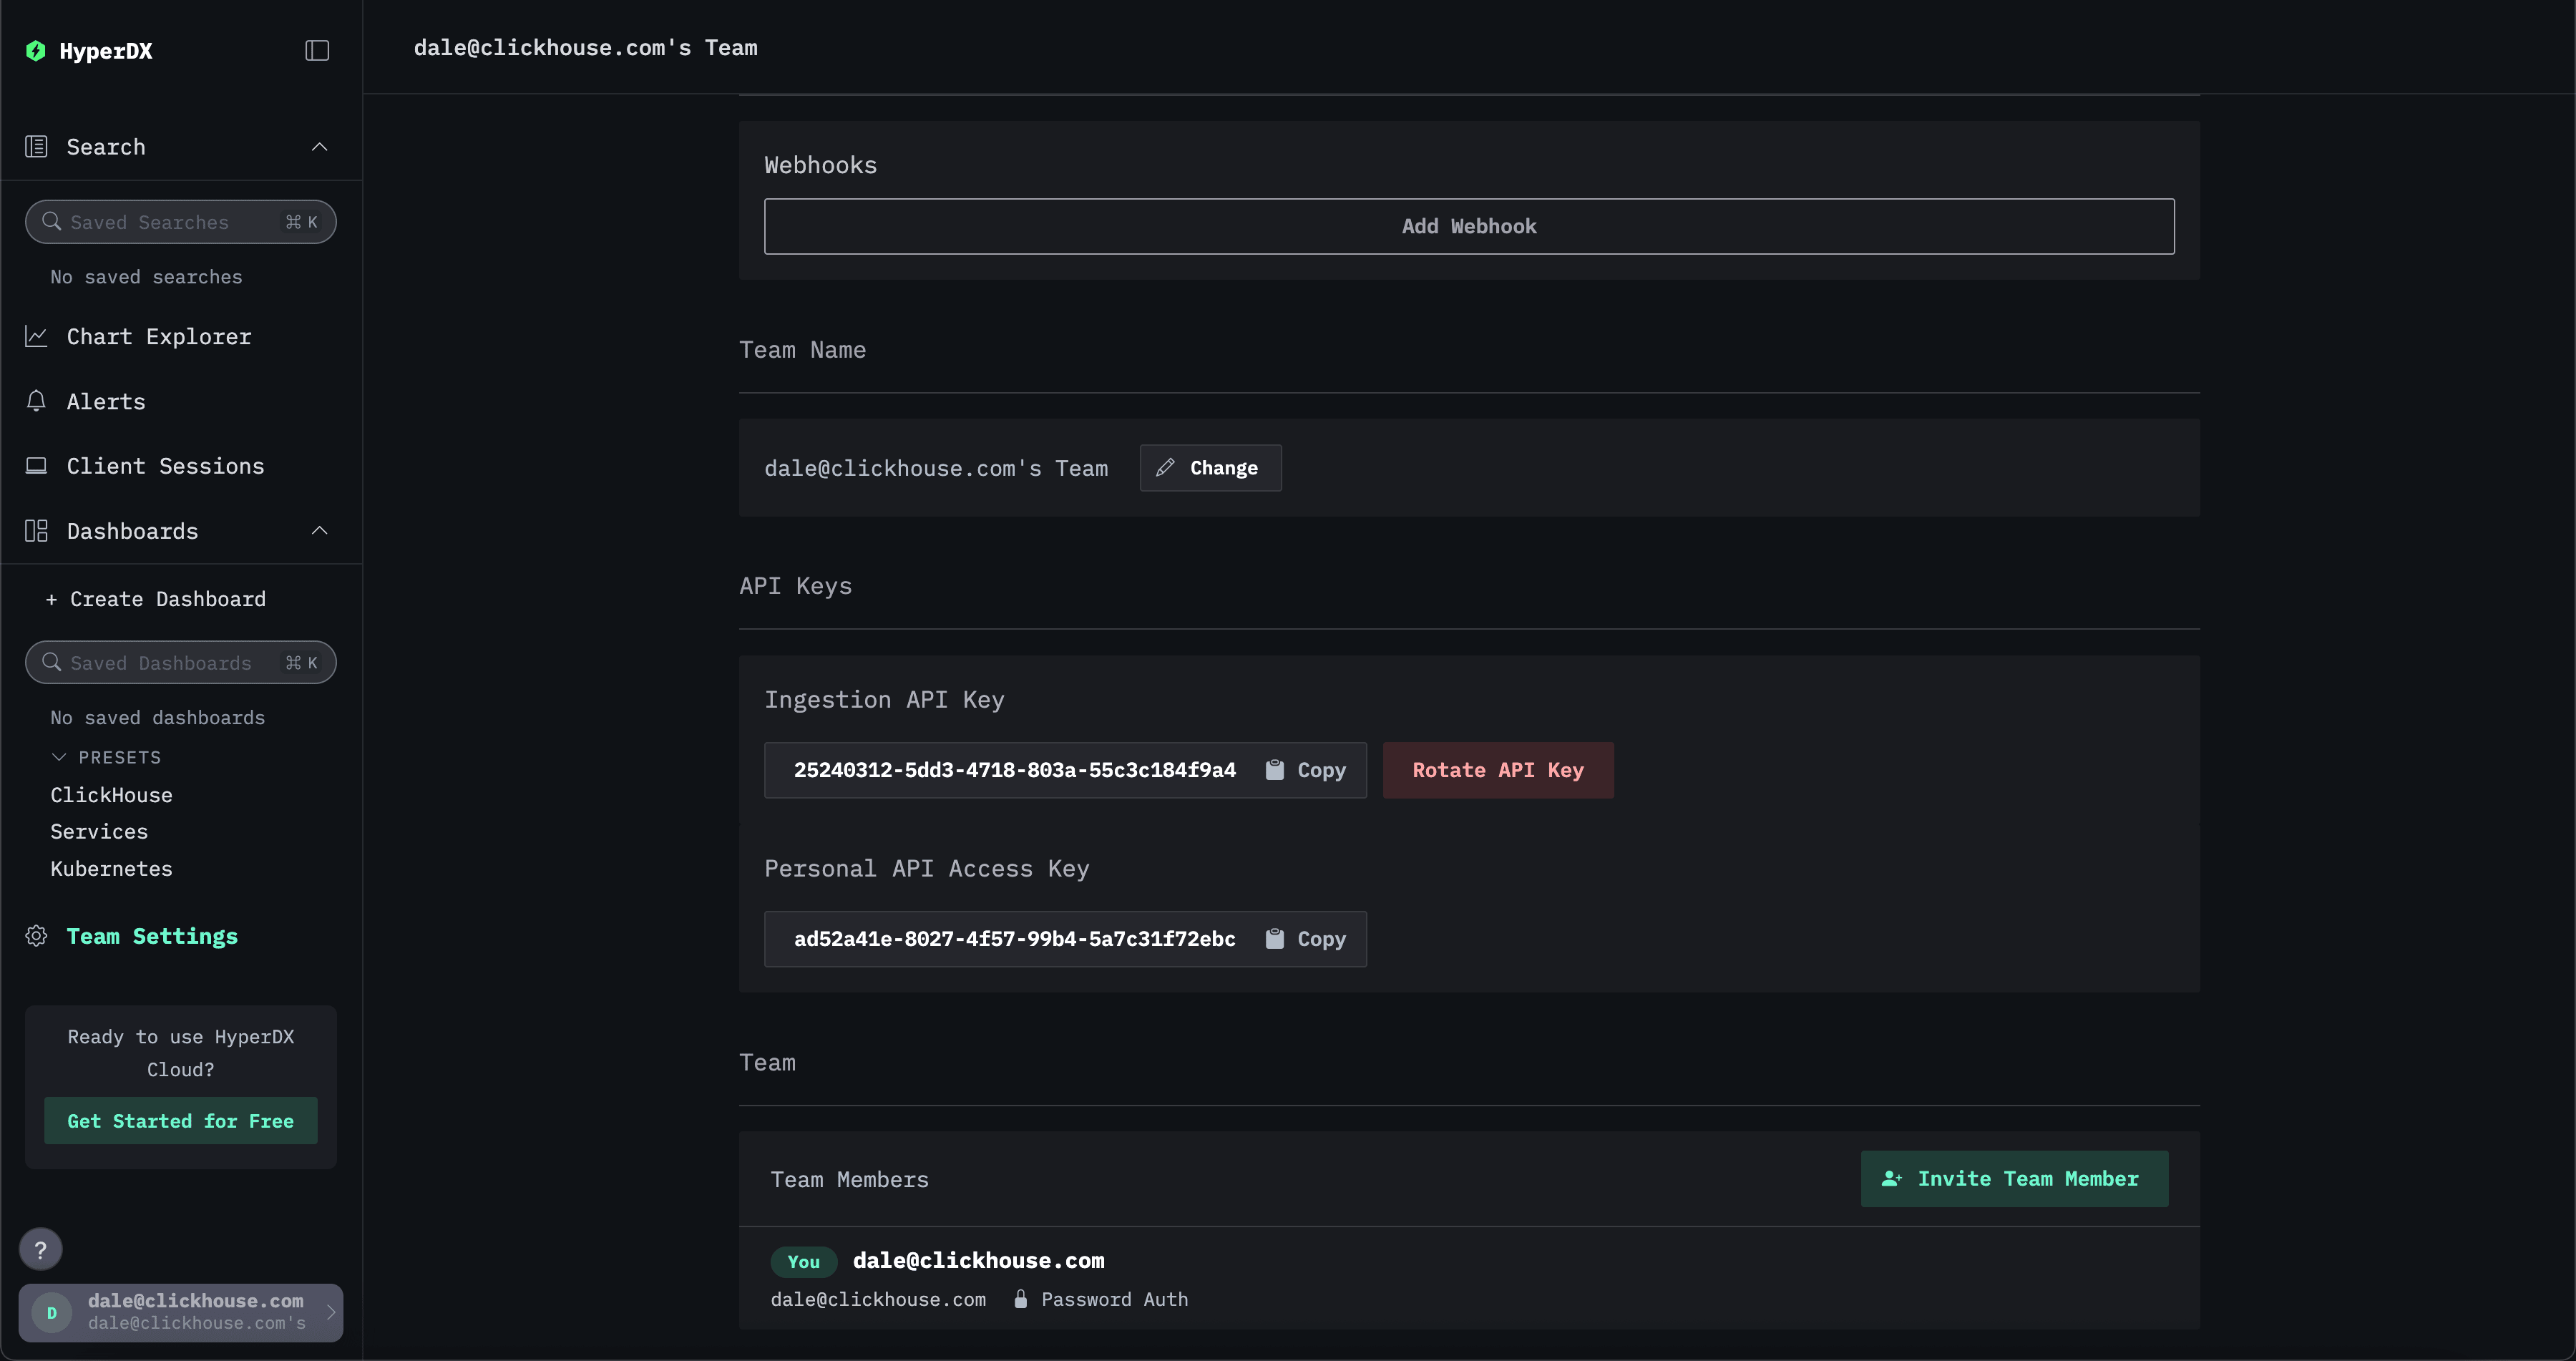
For language SDKs, this can then either be set by an init function or via anOTEL_EXPORTER_OTLP_HEADERS environment variable e.g.:
OTEL_EXPORTER_OTLP_HEADERS='authorization=<YOUR_INGESTION_API_KEY>'Agents should likewise include this authorization header in any OTLP communication. For example, if deploying a contrib distribution of the OTel collector in the agent role, they can use the OTLP exporter. An example agent config consuming this structured log file, is shown below. Note the need to specify an authorization key - see <YOUR_API_INGESTION_KEY>.
# clickhouse-agent-config.yaml
receivers:
  filelog:
    include:
      - /opt/data/logs/access-structured.log
    start_at: beginning
    operators:
      - type: json_parser
        timestamp:
          parse_from: attributes.time_local
          layout: '%Y-%m-%d %H:%M:%S'
exporters:
  # HTTP setup
  otlphttp/hdx:
    endpoint: 'http://localhost:4318'
    headers:
      authorization: <YOUR_API_INGESTION_KEY>
    compression: gzip

  # gRPC setup (alternative)
  otlp/hdx:
    endpoint: 'localhost:4317'
    headers:
      authorization: <YOUR_API_INGESTION_KEY>
    compression: gzip
processors:
  batch:
    timeout: 5s
    send_batch_size: 10000
service:
  telemetry:
    metrics:
      address: 0.0.0.0:9888 # Modified as 2 collectors running on same host
  pipelines:
    logs:
      receivers: [filelog]
      processors: [batch]
      exporters: [otlphttp/hdx]