

 Set up docs MCP
Services in ClickHouse Cloud come with out-of-the-box monitoring components that serve users with dashboards and notifications. By default, all users in the Cloud Console can access these dashboards.
Dashboards
Service health
The Service Health dashboard can be used to monitor the high-level health of a service. ClickHouse Cloud scrapes and stores metrics displayed on this dashboard from system tables so they can be viewed when a service is idled.
Resource utilization
The Infrastructure dashboard provides a detailed view of resources being used by the ClickHouse process. ClickHouse Cloud scrapes and stores metrics displayed on this dashboard from system tables so they can be viewed when a service is idled.
Memory and CPU
The Allocated CPU and Allocated Memory graphs display the total compute resources available for each replica in your service. These allocations can be changed by using ClickHouse Cloud’s scaling features.
The Memory Usage and CPU Usage graphs estimate how much CPU and memory is actually being utilized by ClickHouse processes in each replica, including queries as well as background processes like merges.
These are the corresponding system table metrics displayed on these graphs:
| Graph | Corresponding metric name | Aggregation | Notes |
|---|---|---|---|
| Allocated memory | CGroupMemoryTotal |
Max | |
| Allocated CPU | CGroupMaxCPU |
Max | |
| Memory used | MemoryResident |
Max | |
| CPU used | System CPU metric | Max | ClickHouseServer_UsageCores via Prometheus endpoint |
Data transfer
Graphs display data ingress and egress from ClickHouse Cloud. Learn more about network data transfer.
Advanced dashboard
This dashboard is a modified version of the built-in advanced observability dashboard, with each series representing metrics per replica. This dashboard can be useful for monitoring and troubleshooting ClickHouse-specific issues.
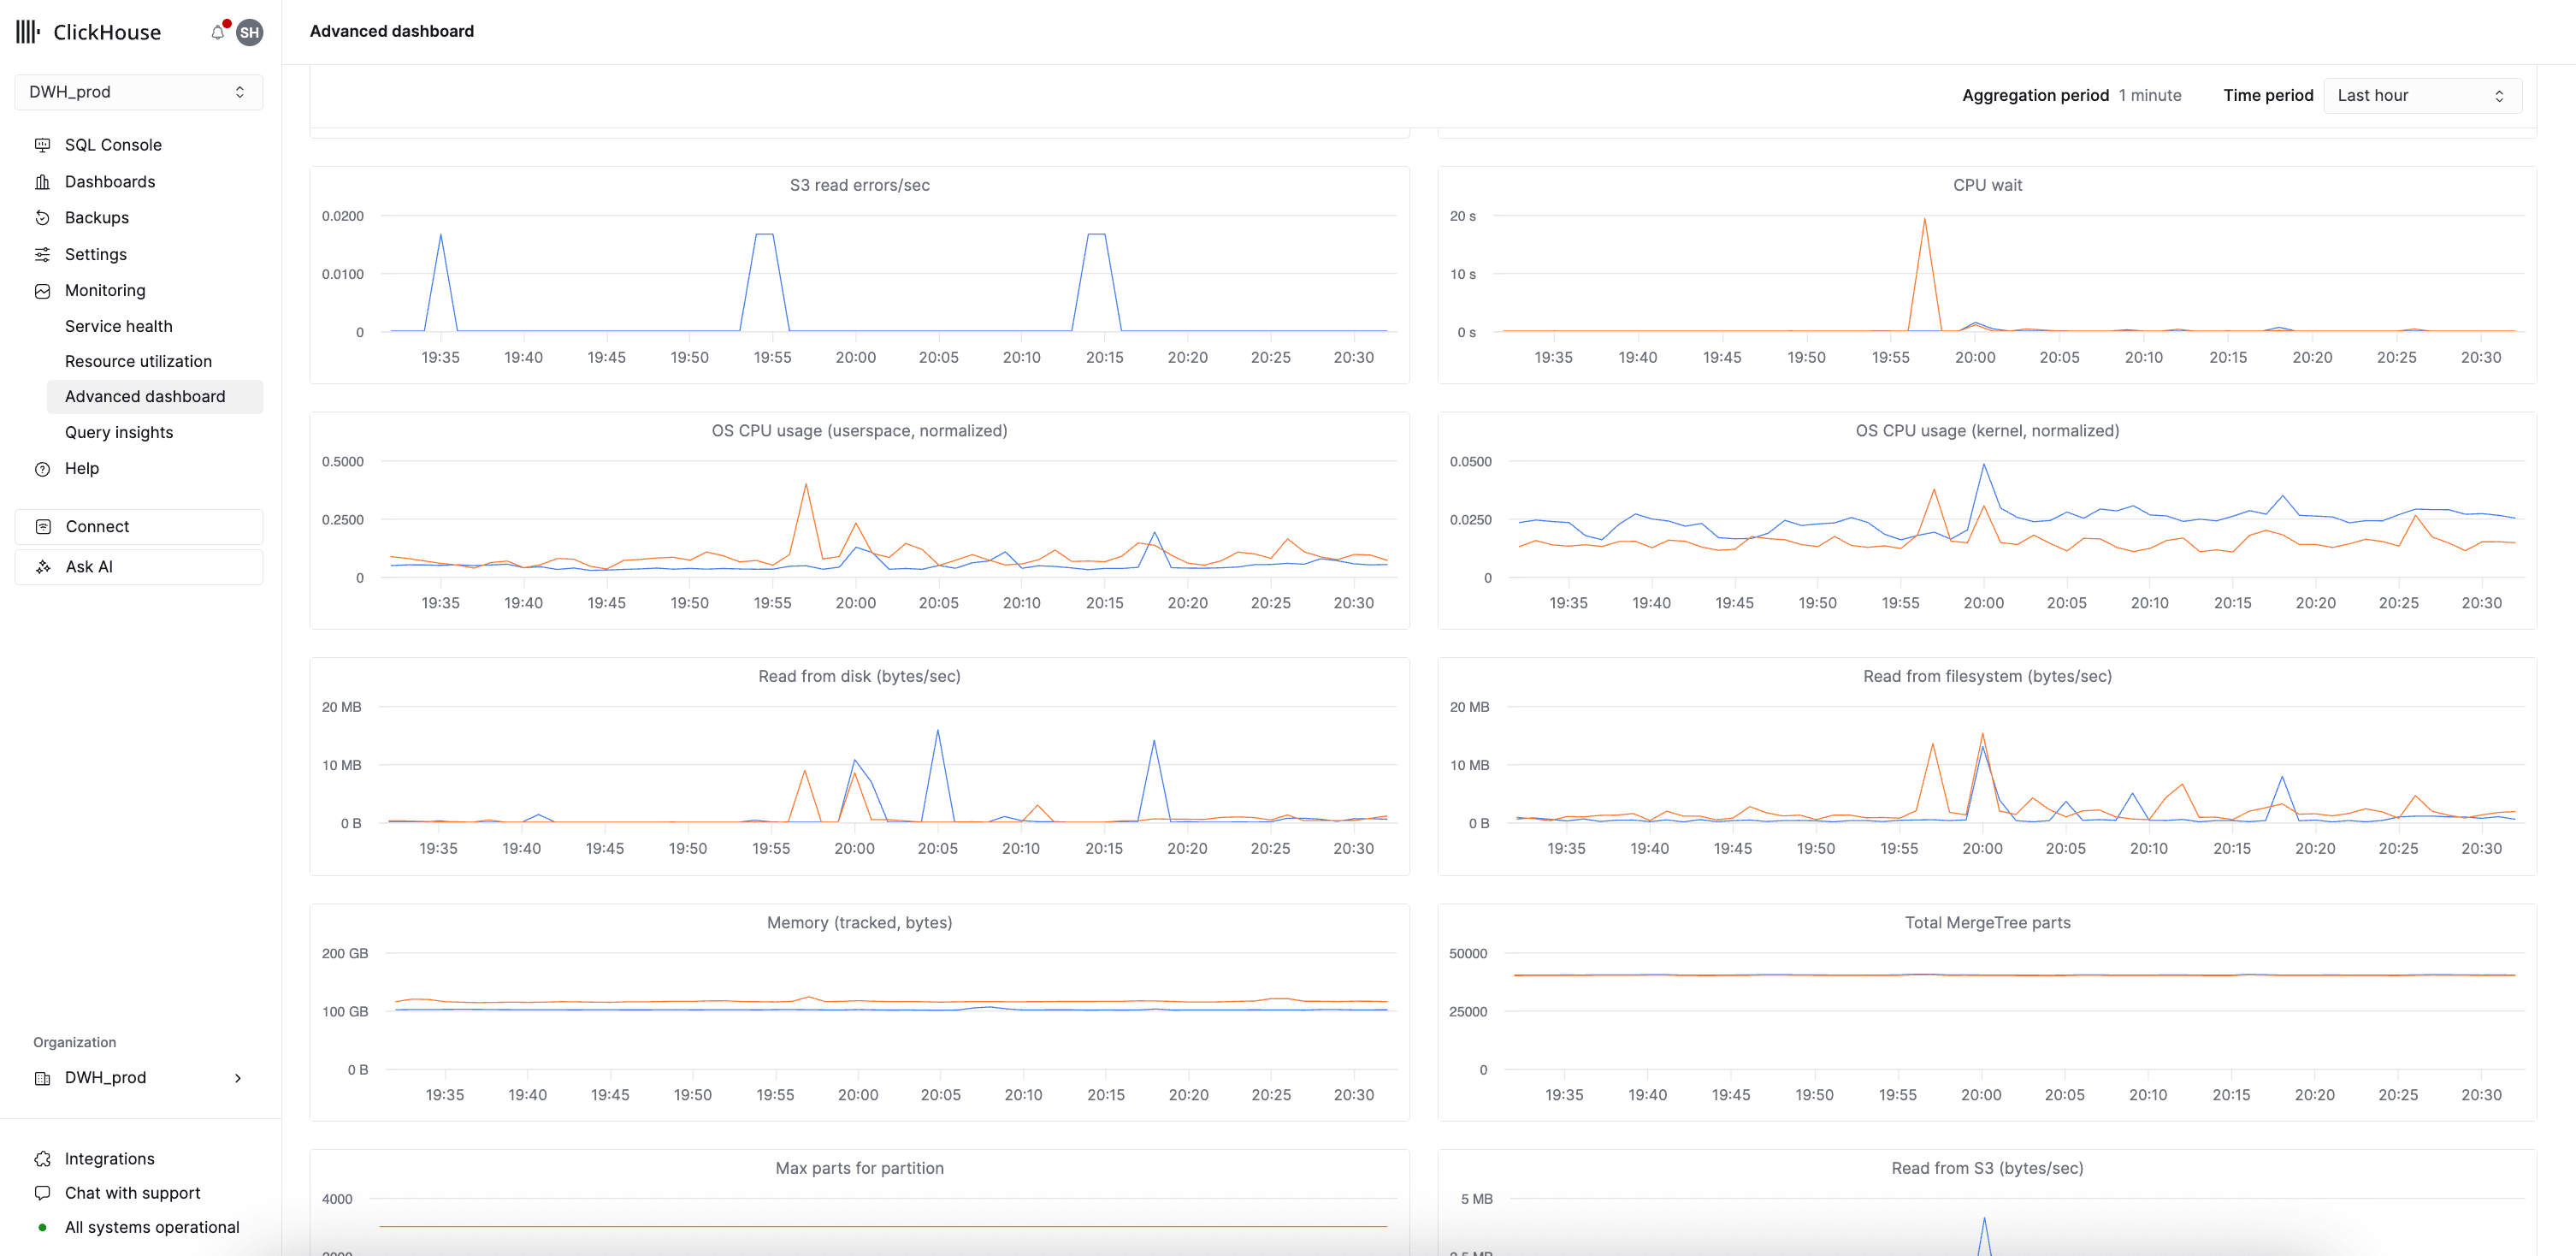
The table below maps each graph in the Advanced Dashboard to its corresponding ClickHouse metric, system table source, and aggregation type:
| Graph | Corresponding ClickHouse metric name | System table | Aggregation Type |
|---|---|---|---|
| Queries/sec | ProfileEvent_Query |
metric_log |
Sum / bucketSizeSeconds |
| Queries running | CurrentMetric_Query |
metric_log |
Avg |
| Merges running | CurrentMetric_Merge |
metric_log |
Avg |
| Selected bytes/sec | ProfileEvent_SelectedBytes |
metric_log |
Sum / bucketSizeSeconds |
| IO Wait | ProfileEvent_OSIOWaitMicroseconds |
metric_log |
Sum / bucketSizeSeconds |
| S3 read wait | ProfileEvent_ReadBufferFromS3Microseconds |
metric_log |
Sum / bucketSizeSeconds |
| S3 read errors/sec | ProfileEvent_ReadBufferFromS3RequestsErrors |
metric_log |
Sum / bucketSizeSeconds |
| CPU wait | ProfileEvent_OSCPUWaitMicroseconds |
metric_log |
Sum / bucketSizeSeconds |
| OS CPU usage (userspace, normalized) | OSUserTimeNormalized |
asynchronous_metric_log |
|
| OS CPU usage (kernel, normalized) | OSSystemTimeNormalized |
asynchronous_metric_log |
|
| Read from disk | ProfileEvent_OSReadBytes |
metric_log |
Sum / bucketSizeSeconds |
| Read from filesystem | ProfileEvent_OSReadChars |
metric_log |
Sum / bucketSizeSeconds |
| Memory (tracked, bytes) | CurrentMetric_MemoryTracking |
metric_log |
|
| Total MergeTree parts | TotalPartsOfMergeTreeTables |
asynchronous_metric_log |
|
| Max parts for partition | MaxPartCountForPartition |
asynchronous_metric_log |
|
| Read from S3 | ProfileEvent_ReadBufferFromS3Bytes |
metric_log |
Sum / bucketSizeSeconds |
| Filesystem cache size | CurrentMetric_FilesystemCacheSize |
metric_log |
|
| Disk S3 write req/sec | ProfileEvent_DiskS3PutObject + ProfileEvent_DiskS3UploadPart + ProfileEvent_DiskS3CreateMultipartUpload + ProfileEvent_DiskS3CompleteMultipartUpload |
metric_log |
Sum / bucketSizeSeconds |
| Disk S3 read req/sec | ProfileEvent_DiskS3GetObject + ProfileEvent_DiskS3HeadObject + ProfileEvent_DiskS3ListObjects |
metric_log |
Sum / bucketSizeSeconds |
| FS cache hit rate | sum(ProfileEvent_CachedReadBufferReadFromCacheBytes) / (sum(ProfileEvent_CachedReadBufferReadFromCacheBytes) + sum(ProfileEvent_CachedReadBufferReadFromSourceBytes)) |
metric_log |
|
| Page cache hit rate | greatest(0, (sum(ProfileEvent_OSReadChars) - sum(ProfileEvent_OSReadBytes)) / (sum(ProfileEvent_OSReadChars) + sum(ProfileEvent_ReadBufferFromS3Bytes))) |
metric_log |
|
| Network receive bytes/sec | NetworkReceiveBytes |
asynchronous_metric_log |
Sum / bucketSizeSeconds |
| Network send bytes/sec | NetworkSendBytes |
asynchronous_metric_log |
Sum / bucketSizeSeconds |
| Concurrent TCP connections | CurrentMetric_TCPConnection |
metric_log |
|
| Concurrent MySQL connections | CurrentMetric_MySQLConnection |
metric_log |
|
| Concurrent HTTP connections | CurrentMetric_HTTPConnection |
metric_log |
For detailed information on each visualization and how to use them for troubleshooting, see the advanced dashboard documentation.
Query insights
The Query Insights feature makes ClickHouse’s built-in query log easier to use through various visualizations and tables. ClickHouse’s system.query_log table is a key source of information for query optimization, debugging, and monitoring overall cluster health and performance.
After selecting a service, the Monitoring navigation item in the left sidebar expands to reveal a Query insights sub-item:
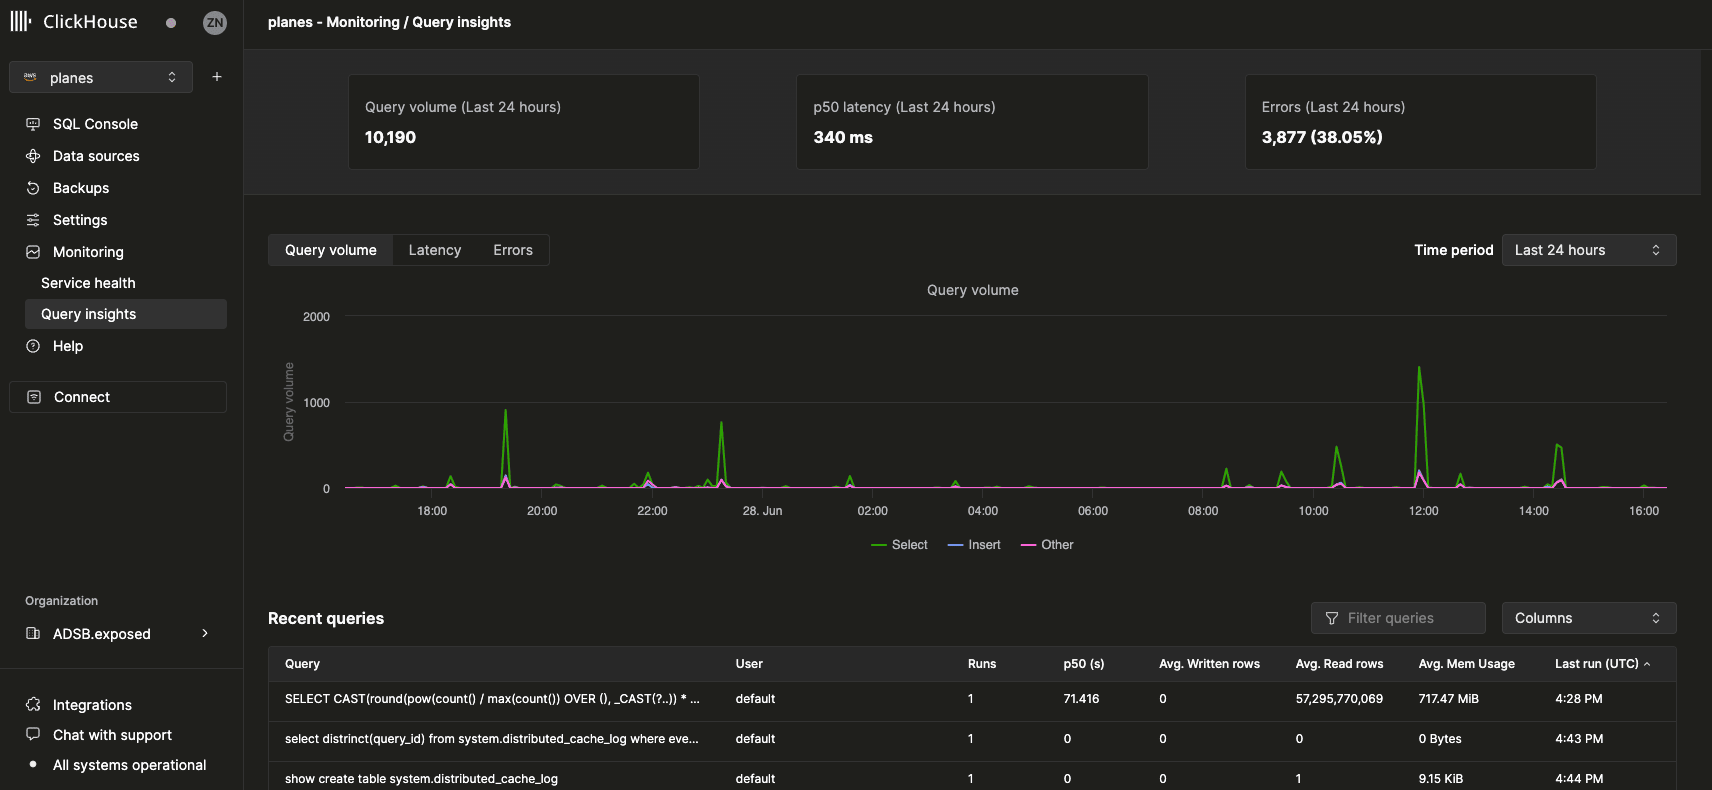
Top-level metrics
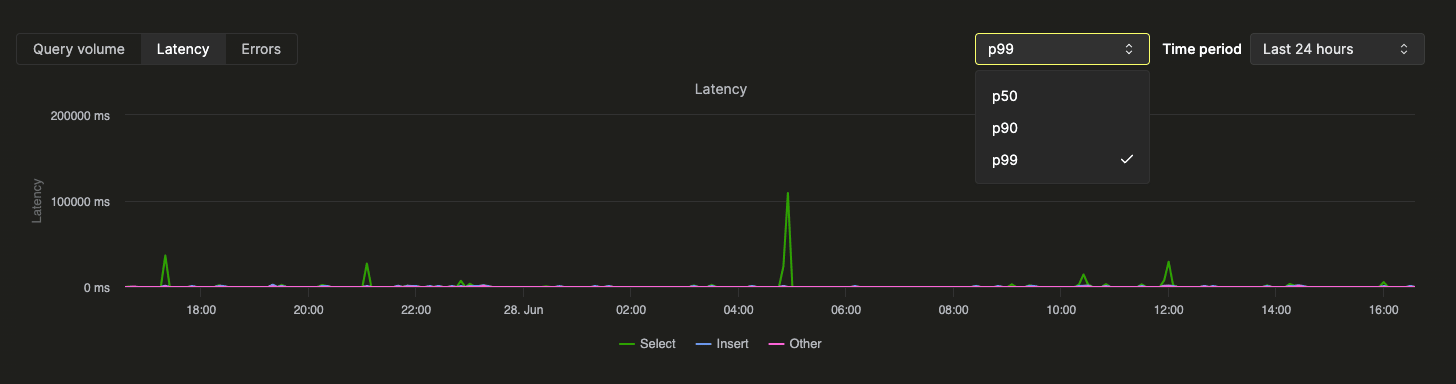
The stat boxes at the top represent basic query metrics over the selected time period. Beneath them, time-series charts show query volume, latency, and error rate broken down by query kind (select, insert, other). The latency chart can be adjusted to display p50, p90, and p99 latencies:
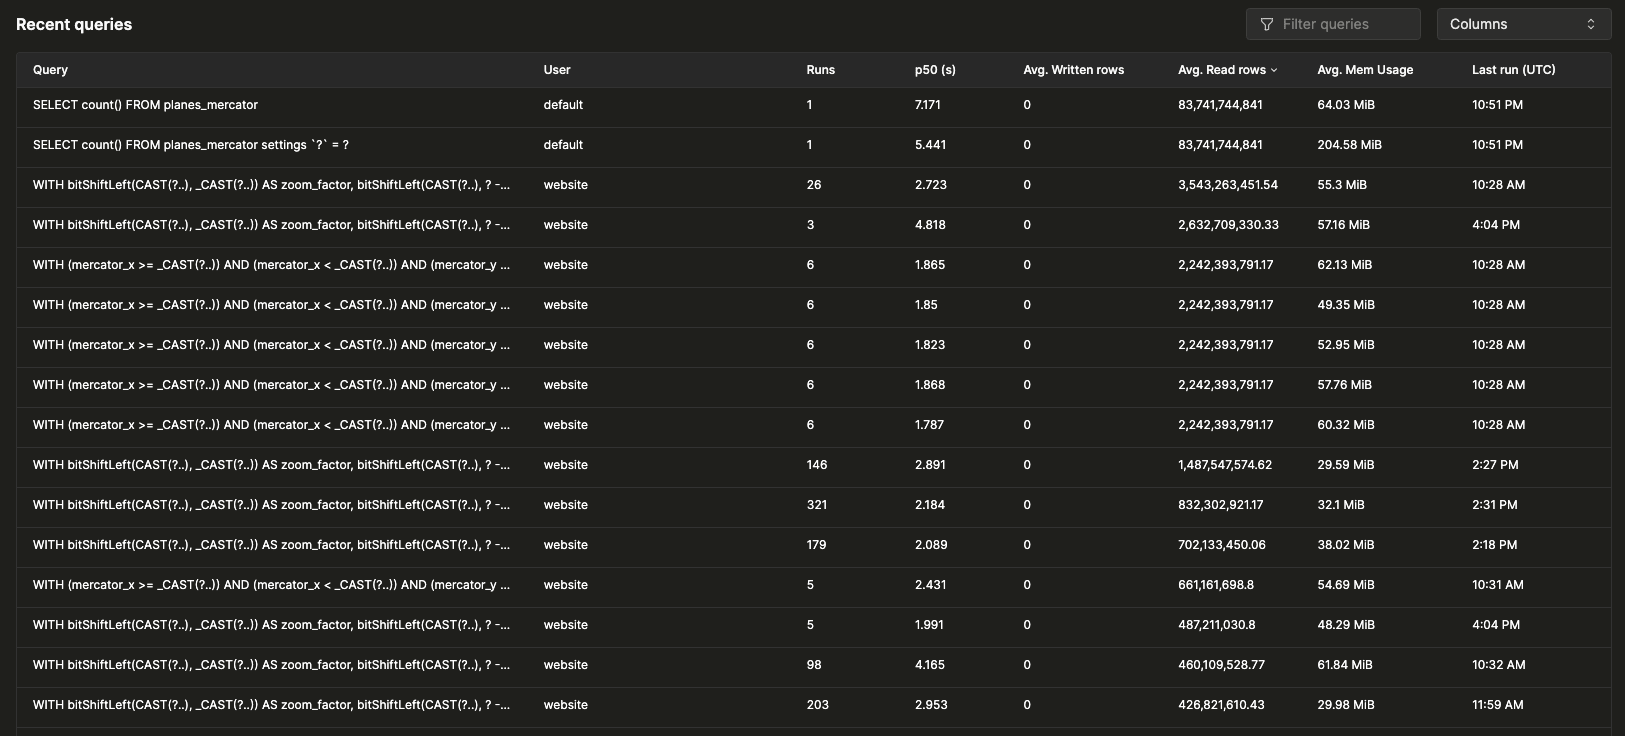
Recent queries
A table displays query log entries grouped by normalized query hash and user over the selected time window. Recent queries can be filtered and sorted by any available field, and the table can be configured to display or hide additional fields such as tables, p90, and p99 latencies:
Query drill-down
Selecting a query from the recent queries table will open a flyout containing metrics and information specific to the selected query:
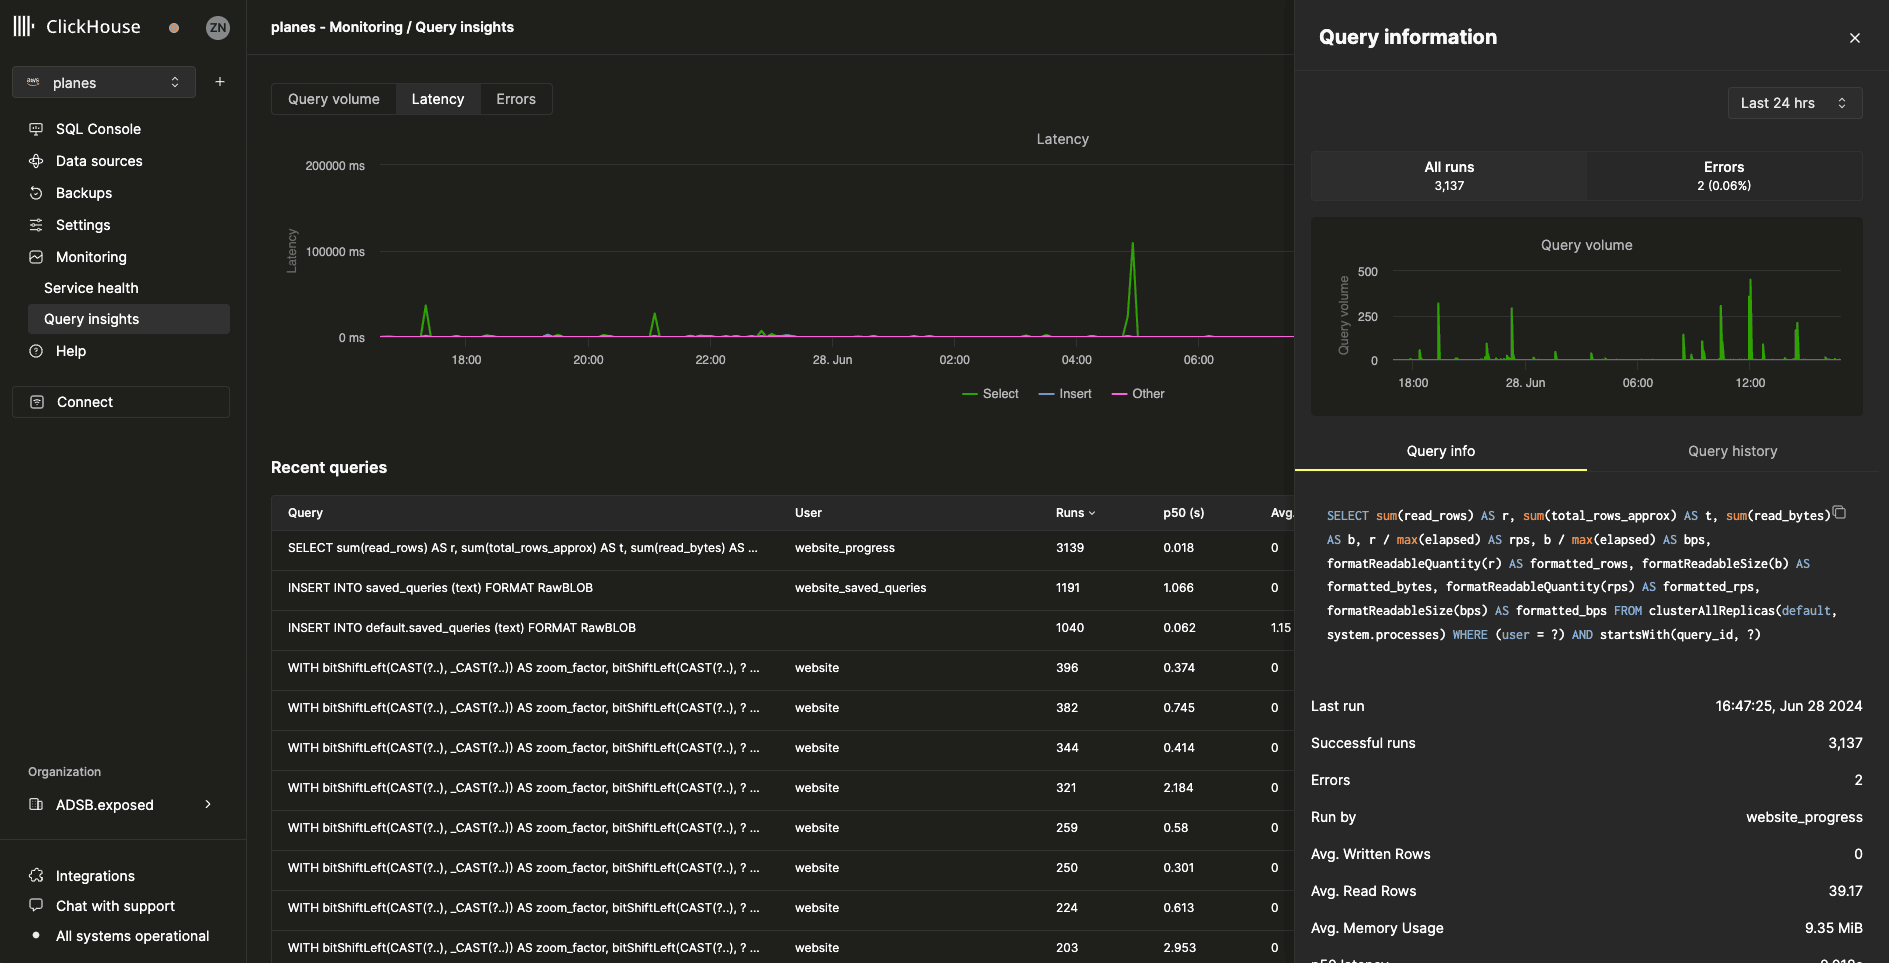
All metrics in the Query info tab are aggregated metrics, but we can also view metrics from individual runs by selecting the Query history tab:
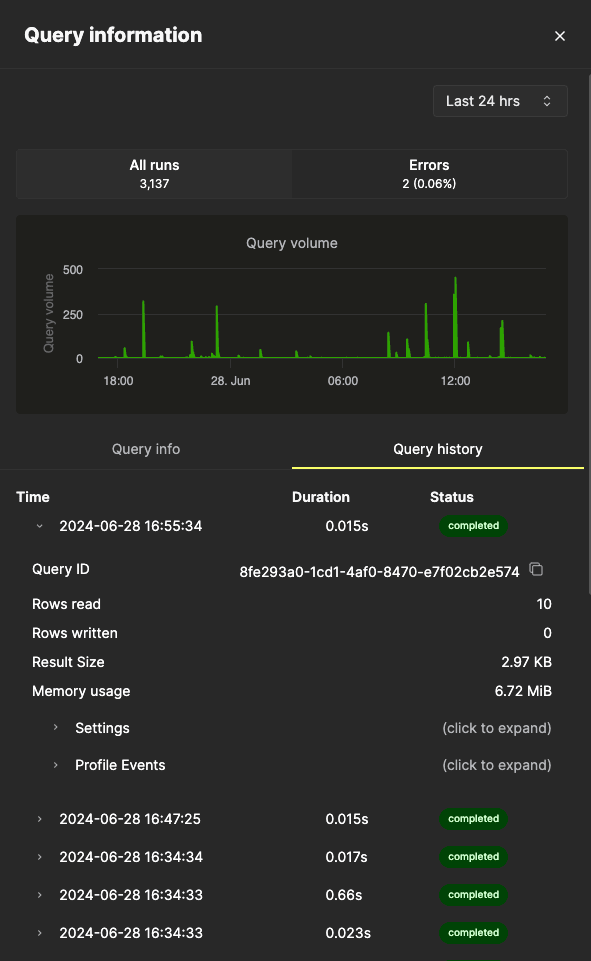
From this pane, the Settings and Profile Events items for each query run can be expanded to reveal additional information.
Related pages
- Notifications — Configure alerts for scaling events, errors, and billing
- Advanced dashboard — Detailed reference for each dashboard visualization
- Querying system tables — Run custom SQL queries against system tables for deep introspection
- Prometheus endpoint — Export metrics to Grafana, Datadog, or other Prometheus-compatible tools